Portland State published the results of a general climate survey, administered during the Spring 2018 quarter, focusing on how students, faculty, staff and administrators felt about issues such as discrimination, respect and open beliefs on campus.
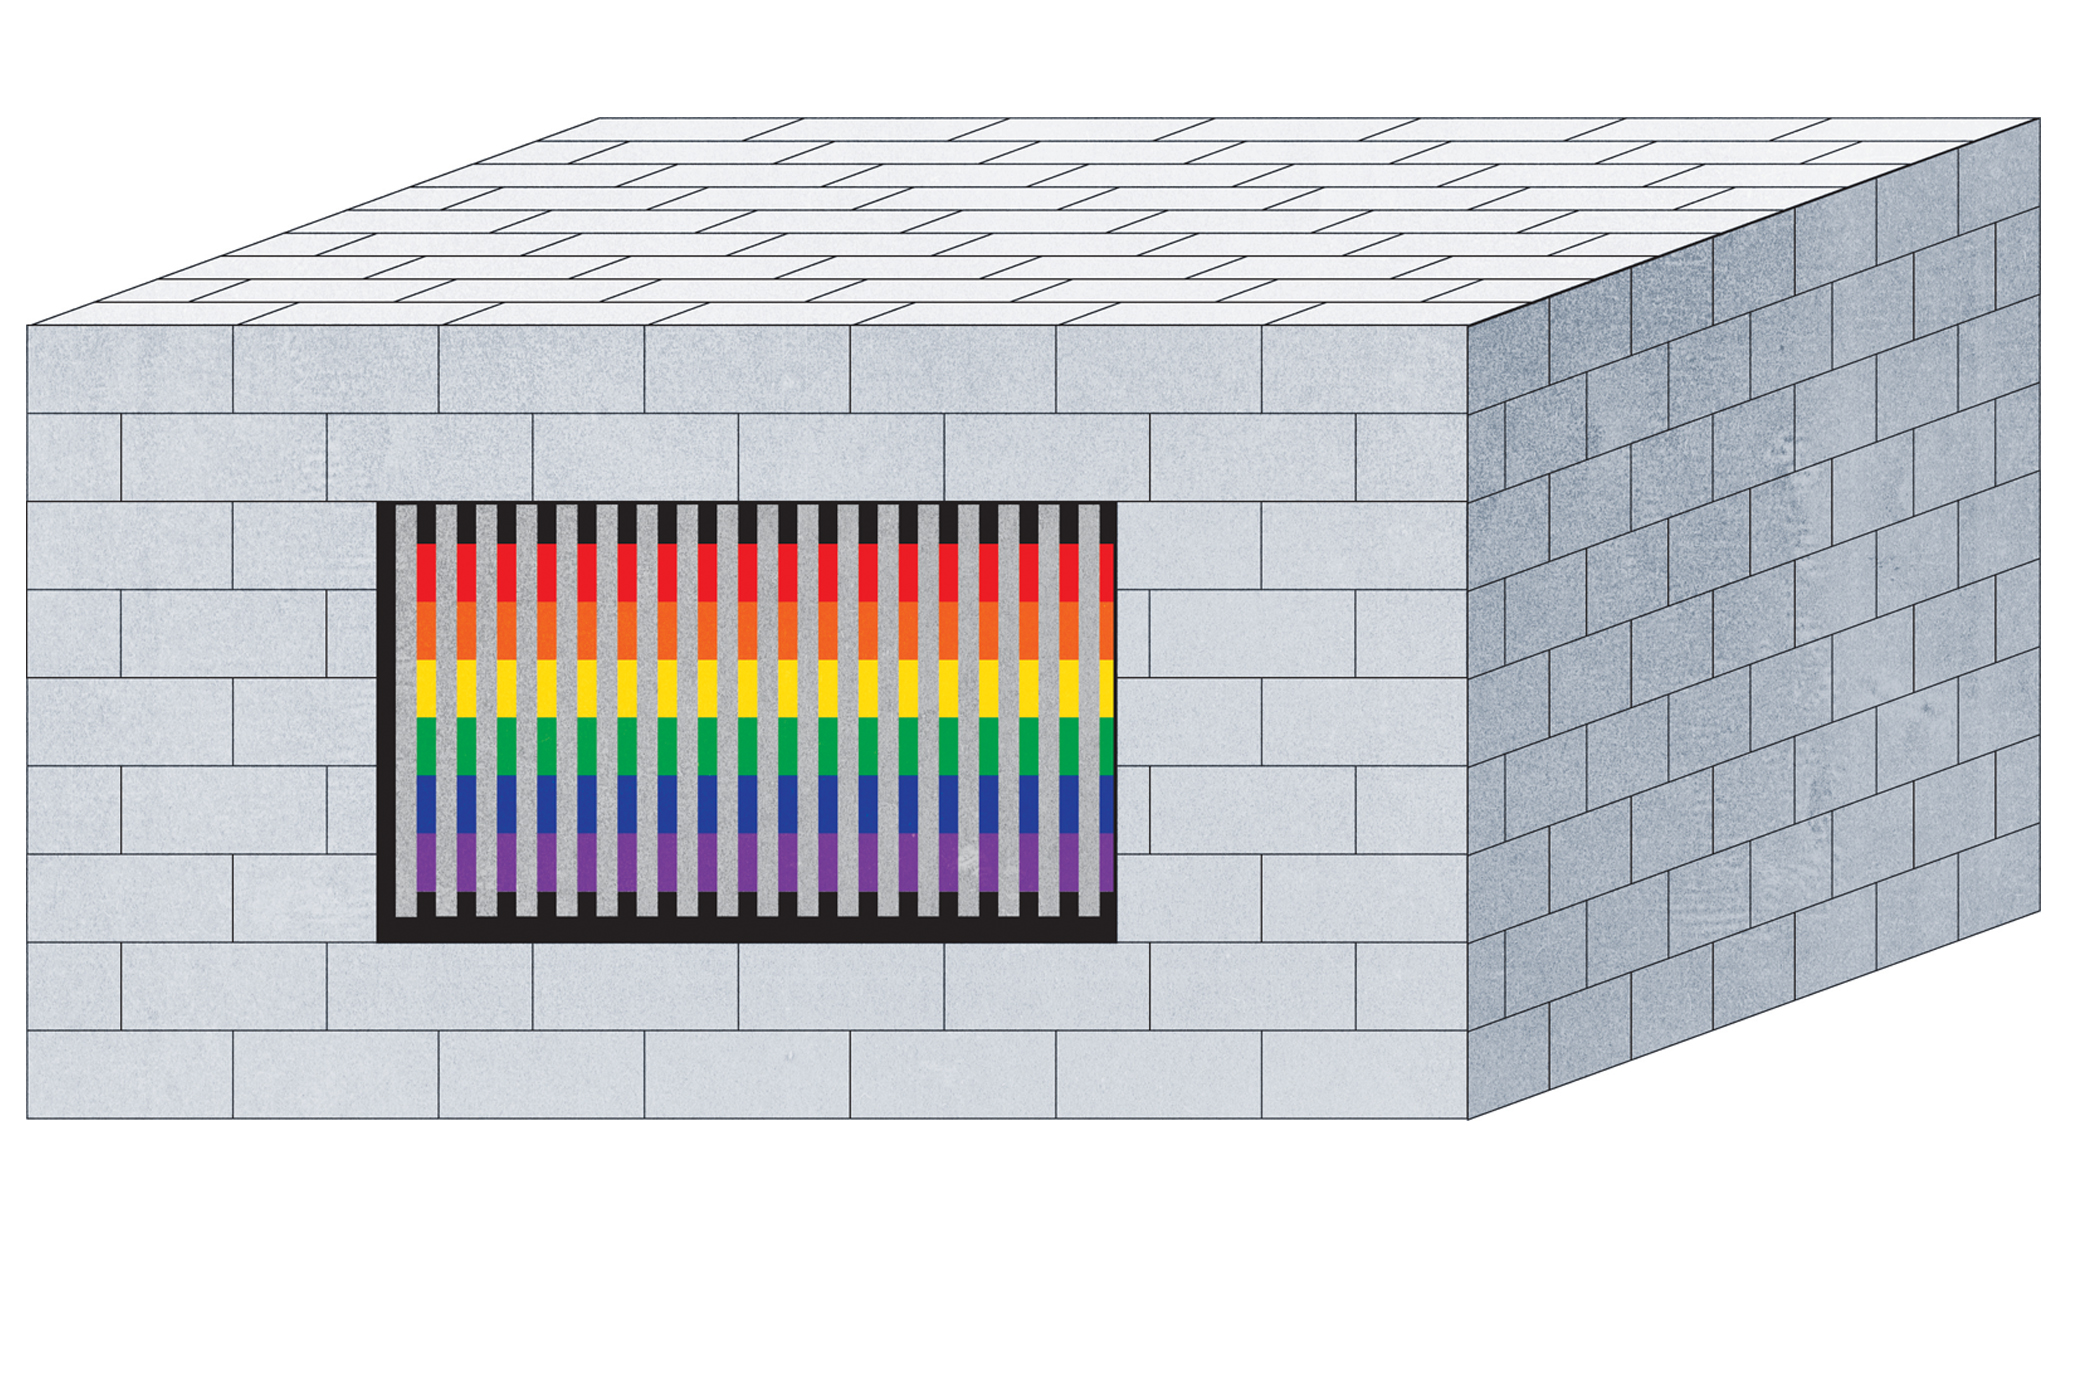
The survey, published on Oct. 21, specifically addressed veterans, individuals with disability, international students and faculty, people of color, LGBTQ+ individuals and women. Four of these categories—veterans, individuals with a disability, people of color and LGBTQ+ people—are illustrated here.
The results show while the majority of surveyed students and faculty strongly agree that they can express their gender identity on campus, less strongly agree on expressing their religion.
Surveyed faculty of color, on average, felt less welcome than surveyed students of color. Only 10.68% of surveyed faculty of color strongly agreed with feeling welcome on campus, as opposed to 30.98% of surveyed students of color.
The results also show both faculty and students in marginalized groups have experienced discrimination, bias or harassment. Approximately 57% of surveyed faculty and 35% of surveyed students experienced discrimination, bias or harassment. The most common form of discrimination was gender discrimination.
For surveyed students, other peers and colleagues were the most common source of bias, harassment or discrimination. For surveyed faculty, other faculty members were the most common source of bias, harassment or discrimination.
The majority of those who experienced bias, harassment or discrimination did not report it. Students and faculty surveyed both stated the most common reason is that it wasn’t important enough. A significant portion of the surveyed faculty also stated they feared losing their jobs.
In a letter addressing the PSU community, Interim President Stephen Percy said the Diversity Action Council’s subcommittees for recruitment and retention of diverse faculty, staff and student reviewed the data and provided recommendations.
Key findings for students include that the majority of student respondents agreed everyone in the campus community should participate in “diversity training.” Another key finding was there is a general trend of feeling welcome and accepted at PSU with students who identify with marginalized groups.
However, the survey warns against interpreting the results as true for the student body. For example, of the 13% of students who responded, 65% identified as white or Caucasian, so those results cannot be interpreted to apply for students of color.
Recommendations for students include helping student groups promote their organizations in order to spread awareness among the community.
Key findings from the subcommittee on faculty include: Half the respondents indicated they experienced discrimination, bias or harassment on the basis of their gender, with a “significantly higher percentage of faculty identifying another faculty member as causing the offense” than other categories.
Recommendations for faculty include learning about faculty retention through exit interviews and surveys, as well as launching a research study led by faculty of color to understand the recruitment and retention experiences of faculty from “traditionally marginalized groups.”
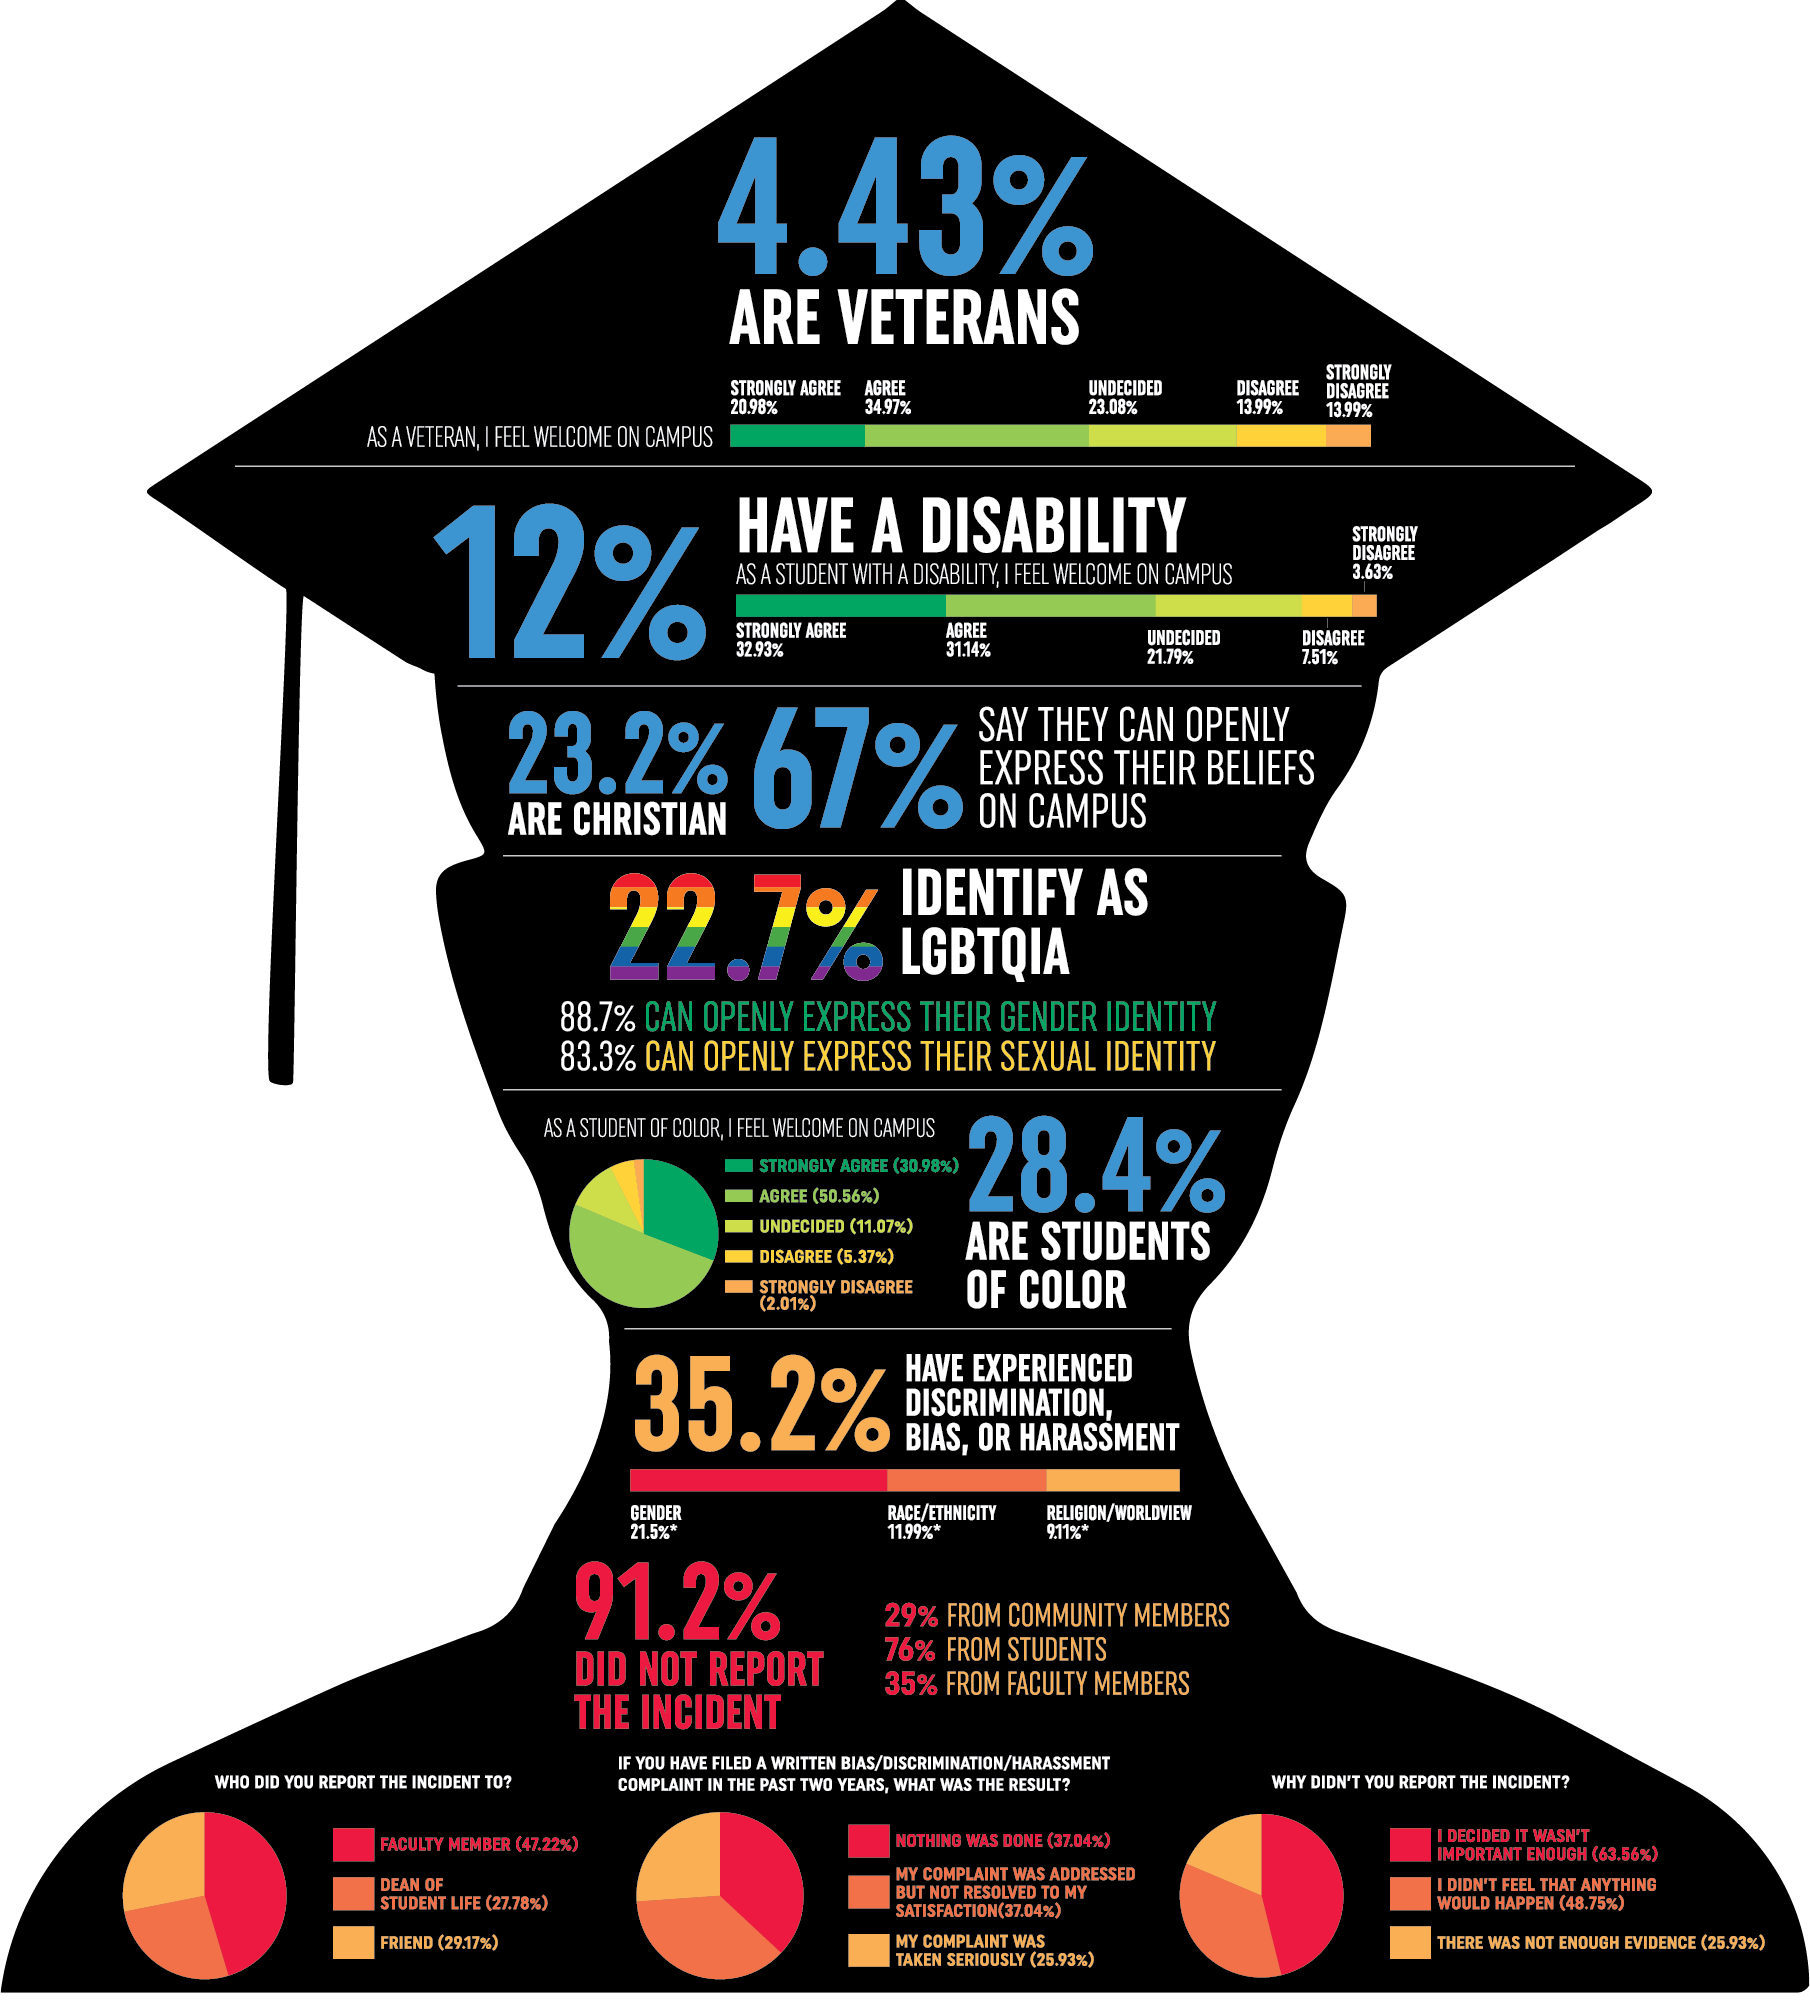
Invitations to participate in the survey were sent to 24,894 students enrolled during winter term 2018. Approximately 3,280 students (13%) responded to the survey. Individual answers may overlap.
Are you a U.S. military veteran?
4.43% yes, 95.57% no
To what extent do you agree or disagree with the following statement? As a veteran, I feel welcome on campus
20.98% strongly agree, 34.97% agree, 23.08% undecided, 13.99% disagree, 6.99% strongly disagree
Q9 Do you have a disability?
10% yes, 90% no
Q12 To what extent do you agree or disagree with the following statement? As a student with a disability, I feel welcome on campus
93% strongly agree, 34.14% agree, 21.79% undecided, 7.51% disagree, 3.63% strongly disagree
Q13 What is your religion/worldview/spiritual affiliation? TOP 3 – Atheist/Agnostic, Christian and Roman Catholic, Buddhist
Atheist/Agnostic 39.42%, Christian and Roman Catholic 23.17%, Buddhist 3.53%
Q14 To what extent do you agree or disagree with the following statement? I can openly express my religious/spiritual beliefs on campus
27.38% strongly agree, 39.27% agree, 21.64% undecided, 7.34% disagree, 4.37% strongly disagree
Q16 Do you identify as LGBTQIA+?
22.70% yes, 69.01% no, 8.29% not sure
Q17 To what extent do you agree or disagree with the following statements? I can openly express my gender identity on campus AND I can openly express my sexual identity on campus
I can openly express my gender identity on campus
49.84% strongly agree, 38.89% agree, 8.24% undecided, 1.88% disagree, 1.15% strongly disagree
I can openly express my sexual identity on campus
40.98% agree, 42.34% agree, 12.30% undecided, 3.02% disagree, 1.36% strongly disagree
Q20 Are you a student of color?
28.36% yes, 71.64% no
Q21 To what extent do you agree or disagree with the following statement? As a student of color, I feel welcome on campus
30.98% strongly agree, 50.56% agree, 11.07% undecided, 5.37% disagree, 2.01% strongly disagree
Q31 Have you experienced any discrimination, bias, or harassment at PSU? Check all that apply. TOP 3
I have not experienced discrimination, bias or harassment 64.85%
Discrimination/bias/harassment based on gender 16.52%
Discrimination/bias/harassment based on race/ethnicity 11.99%
Discrimination/bias/harassment based on religion/worldview/spiritual affiliation 9.11%
Q33 Who caused the offense? Check all that apply TOP 3
Student 75.58%
Faculty member 35.25%
Member of the surrounding community 28.57%
Q34 Did you report the incident?
8.84% yes, 91.16% no
Q35 Who did you report the incident to? Check all that apply. TOP 3
Faculty member 47.22% , Dean of Student Life 27.78%, Friend 29.17%
Q36 If you have filed a written bias/discrimination/harassment complaint in the past two years, what was the result?
37.04% Nothing was done, 37.04% My complaint was addressed but not resolved to my satisfaction, 25.93% my complaint was taken seriously
Q37 Why didn’t you report the incident? Check all that apply.
63.56% I decided it wasn’t important enough, 48.75% I didn’t feel that anything would happen, 25.43% there was not enough evidence
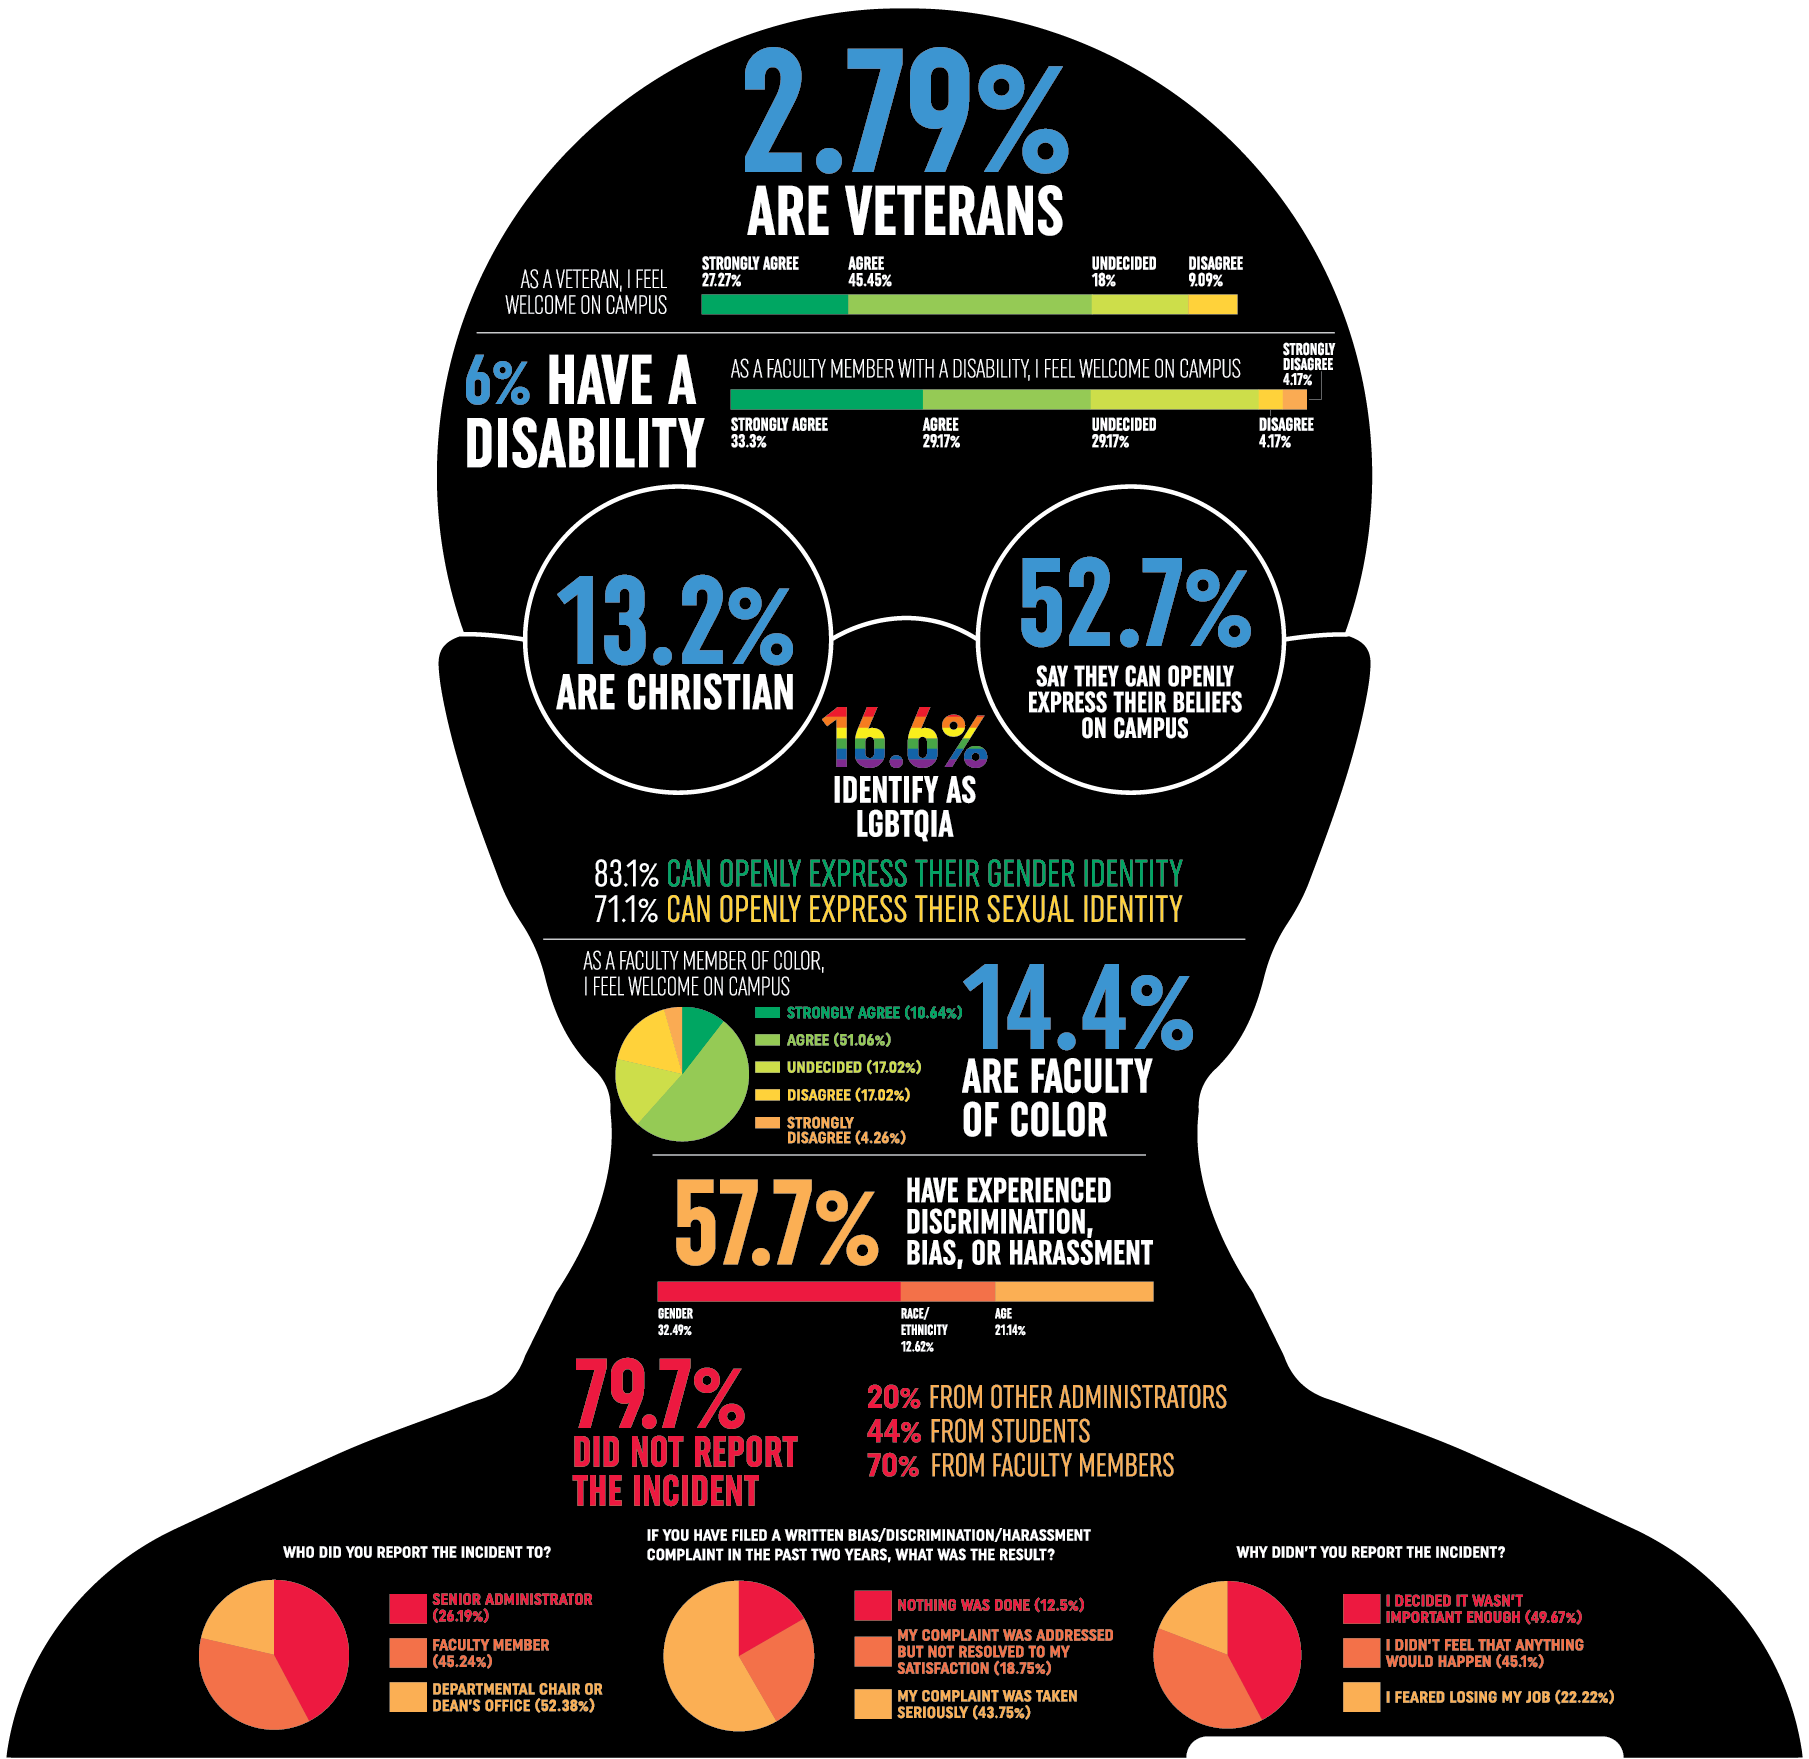
Invitations to participate in the survey were sent to 1,717 faculty members employed during the winter term 2018. Approximately 425 faculty members (25%) responded to the survey.
Q6 Are you a U.S. military veteran?
2.79% yes, 97.21% no
Q7 To what extent do you agree or disagree with the following statement? As a veteran, I feel welcome on campus
27.27% strongly agree, 45.45% agree, 18% undecided, 9.09% disagree, 0.00% strongly disagree
Q8 Do you have a disability?
5.91% yes, 94.09% no
Q10 To what extent do you agree or disagree with the following statement? As an employee with a disability, I feel welcome on campus
33.33% strongly agree, 29.17% agree, 29.17% undecided, 4.17% disagree, 4.17% strongly disagree
Q12 What is your religion/worldview/spiritual affiliation?
40.05% Atheist/Agnostic, Christian and Roman Catholic 13.19%, Buddhist 4.80%
Q13 To what extent do you agree or disagree with the following statement? I can openly express my religious/spiritual beliefs on campus
14.63% strongly agree, 11% agree, 28.35% undecided, 14.63% disagree, 4.27% strongly disagree
Q15 Do you identify as LGBTQIA+?
Yes 16.62%, no 80.35%, not sure 3.02%
Q16 To what extent do you agree or disagree with the following statements? I can openly express my gender identity on campus AND I can openly express my sexual identity on campus
I can openly express my gender identity on campus
40.26% strongly agree, 42.86% agree, 9.09% undecided, 6.49% disagree, 1.30% strongly disagree
I can openly express my sexual identity on campus
28.95% strongly agree, 42.11% agree, 17.11% undecided, 10.53% disagree, 1.32% strongly disagree
Q17 Are you a faculty member of color?
14.42% yes, 85.58% no
Q18 To what extent do you agree or disagree with the following statements? As a faculty member of color, I feel welcome on campus
10.64% strongly agree, 51.06% agree, 17.02% undecided, 17.02% disagree, 4.26% strongly disagree
Q34 Have you experienced any discrimination, bias or harassment? Check all that apply.
I have not experienced discrimination, bias or harassment 42.27%
Discrimination/bias/harassment based on gender 32.49%
Discrimination/bias/harassment based on race/ethnicity 12.62%
Discrimination/bias/harassment based on age 21.14%
Q36 Who caused the offense? Check all that apply.
Faculty Member 69.91%
Student 43.98%
Other Administrator 19.91%
Q37 Did you report the incident?
20.26% yes, 79.74% no
Q38 Who did you report the incident to? Check all that apply.
Departmental Chair or Dean’s office 52.38%
Faculty Member 45.24%
Senior Administrator 26.19%
Q39 If you have filed a written bias/discrimination/harassment complaint in the past two years, what was the result? Check all that apply
My complaint was taken seriously 43.75%
My complaint was addressed but not resolved to my satisfaction 18.75%
Nothing was done 12.50%
Q40 Why didn’t you report the incident? Check all that apply.
I decided it wasn’t important enough 49.67%
I didn’t feel anything would happen 45.10%
I feared losing my job 22.22%

